(see explanations below the screen shot)
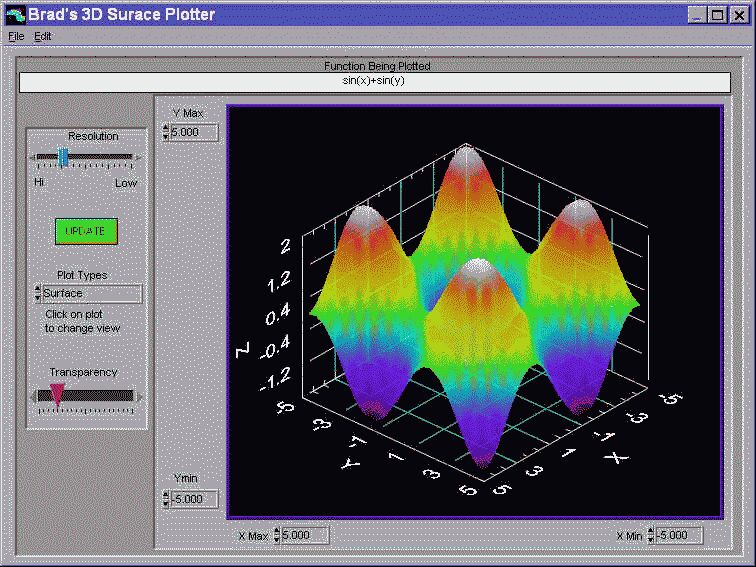
The 3d Plot is a very powerful plotting tool. It allows you to click on the plot and turn it any way you want.
In this example we see the math expression: "sin(x) + sin(y)" You are able to use points, surface, or lines to
show your plot. You can also set the transparency level to allow you to see the grid better.